December 29, 2025 at 13:39
S&P 500 Valuations Under the Microscope as AI Fuels Market Gains
Authored by MyEyze Finance Desk
The S&P 500 delivered strong 2025 returns, fueled by AI and resilient earnings, but fundamental analysis reveals a market at historically high valuations with negative risk premiums, record debt, and narrowing breadth. This report breaks down the core metrics, economic underpinnings, and sector dynamics every investor should understand.
Executive Summary: A Market of Strength and Caution
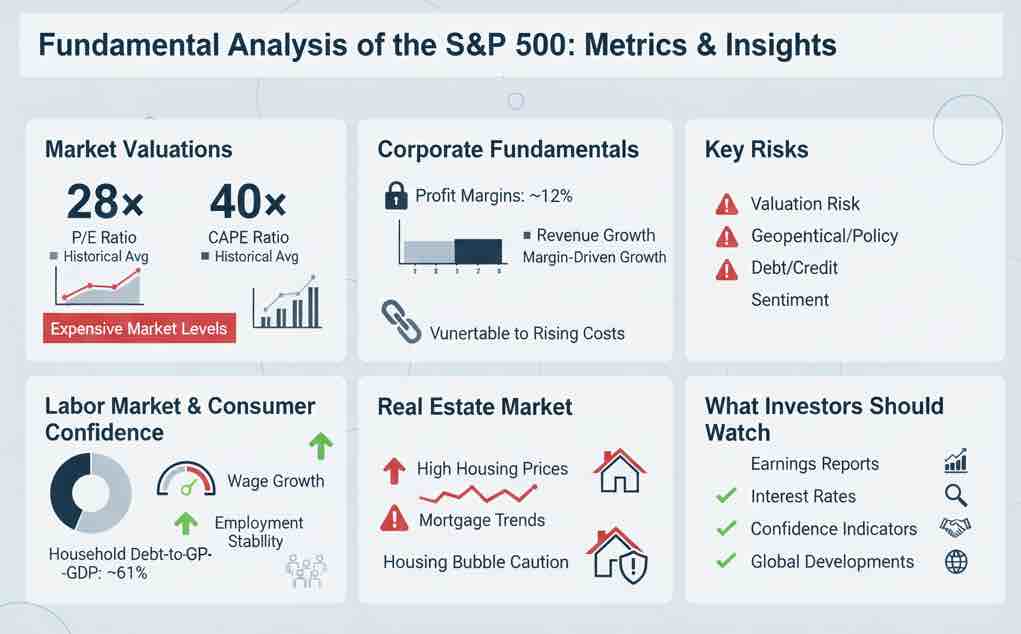
The S&P 500 has delivered robust returns in 2025, up approximately 17.8% year-to-date as of late November, driven by AI-fueled tech gains and resilient earnings. However, valuations remain elevated across key metrics, signaling caution for long-term investors. The trailing P/E ratio stands at 31x(in contrast to mean of 16.5x), while the Shiller CAPE exceeds 40, approaching dot-com-era highs. Equity risk premiums have turned negative, highlighting the relative appeal of bonds amid 4.15% 10-year Treasury yields.
1. Core Valuation Metrics: How Expensive Is the Market?
- Price-to-Earnings (P/E): Trailing P/E is 31x, far above historical averages. Forward P/E is 23.2x, still elevated.
- Shiller CAPE Ratio: Stands at 40x, ~20% above its 100-year average and near 2000 dot-com peak levels.
- Equity Risk Premium (ERP): Has turned negative at -0.91%, making bonds relatively more attractive.
- Dividend Yield: At 1.15%, near historic lows, emphasizing reliance on capital gains.
2. Macro Valuation Indicators: The Bigger Picture
The Buffett Indicator (total market cap to GDP) sits at 224.9%, indicating significant overvaluation and surpassing previous peaks in 2000 (190%) and 2008 (110%). Meanwhile, corporate net profit margins reached 13.1% in Q3 2025(historical average is 6.31%), well above long-term averages. These high margins signal potential mean reversion, especially if input costs rise. Projected S&P 500 revenue growth is 7.3% for Q4 2025, driven by tech and services, but margins have expanded faster than revenues outside tech, highlighting a dependence on cost efficiency.
3. Debt & Leverage Conditions: The Foundation's Cracks
Key Points
- Corporate Debt: $1+ trillion in maturities due in 2025. Refinancing risk exists if rates remain high.
- Household Debt: Total reached $18.59T, with rising credit card balances and student loans indicating stress.
- Government Debt: Debt-to-GDP at ~130%, with deficits of $1.78T. High deficits could pressure interest rates higher.
4. Labor Market & Wages: The Consumer Engine
The labor market shows signs of softening. Unemployment rose to 4.6%, wage growth moderated, JOLTS job openings declined to 7.7M(as per october 2025 report). Hiring trends are weakening, signaling slower momentum. Worker bargaining power has seen unionization rates stabilize at 10.1% and an increase in strikes, boosting leverage but not yet fueling significant inflationary pressures.
5. Housing & Real Estate: Bubble Territory?
In housing, price-to-income ratios reached 5x(nationally and over 10x for california and New York) indicating bubble territory. Mortgage rates averaged 6.19%, severely limiting affordability. Compared to 2005-07, valuations are elevated but supply shortages may prevent sharp declines. In commercial real estate, office vacancies reach up to 19.5% in some markets while retail is at 5.8%(Q3;cushman&wakefield), highlighting an uneven recovery. Loan rollover risks exceed $1 trillion, with industrial real estate being the standout performer.
6. Consumer & Business Sentiment: The Mood of the Market
Consumer confidence, as measured by the Michigan Sentiment (52.9) and Conference Board Confidence (89.1), remains low relative to historical norms, signaling cautious spending behavior. Retail sales grew a modest 3.88% YoY, led by necessities. On the business side, the ISM Manufacturing PMI (48.2) shows contraction, while Services PMI (54.10) remains in expansion. Capital expenditure grew YoY, heavily led by AI investments in tech, though an overall tone of caution prevails.
7. Market Breadth & Volatility: Concentration and Leverage Risks
A significant concentration risk exists: the "Magnificent 7" tech stocks drove majority of the S&P 500's gains this year, indicating dangerously narrow market breadth. Historically, such concentration has preceded corrections. Volatility, as measured by the VIX, averaged a relatively calm 16.5, but the skew index at 148 and margin debt reaching $1.21T (+47% YoY) highlight underlying leverage and positioning risks in the market.
8. Sector-Specific Insights: A Tale of Many Markets
| Sector | YTD Return | Forward P/E | Key Theme |
|---|---|---|---|
| Technology | +25% | 28.95x | AI boom, narrow concentration |
| Energy | +8% | 12.5x | Renewables transition |
| Healthcare | +12% | 18.2x | Cost pressures, aging demographics |
| Financials | +15% | 16.8x | CRE exposure |
| Industrials | +10% | 24.39x | Reshoring gains |
| Consumer Discretionary | +6% | 20.1x | Saturation slowdown |
This table illustrates the dispersion in returns and valuations, with Technology leading on both metrics but carrying the highest valuation multiple.
9. Additional Macro Considerations
- Demographics: An aging population limits labor force growth to just 0.4% annually.
- Productivity: Accelerating via AI and automation, which supports corporate margins without necessarily driving inflation.
- Global Factors: China’s slowdown (4.5% GDP growth) and sluggish European growth (1.2%) constrain exports, while persistent geopolitical risks add uncertainty.
- Real Interest Rate Adjusted Valuation: When adjusted for real interest rates, the S&P 500's effective P/E is ~25x, implying a potential 10-15% downside to fair value.
- Job Market: Job losses being observed;overall job market is in a non hire no fire state
Conclusion & Investor Takeaways
- Earnings Reports: Watch for surprises in early 2026 guidance.
- Labor Market Trends: Further weakening in hiring or a rise in unemployment could weigh heavily on growth expectations.
- Federal Reserve Actions: Any pivot in interest rate policy or shifts in liquidity can drive significant market volatility.
- Debt & Leverage: Closely monitor corporate refinancing activities and the level of investor margin debt.
- Global Developments: Trade tensions, geopolitical conflicts, and supply chain disruptions remain persistent tail risks.
Final Word of Caution
Disclaimer
This article is for educational purposes only and should not be interpreted as financial advice. Readers should consult a qualified financial professional before making investment decisions. Part of this content was created with formatting and assistance from AI-powered generative tools. The final editorial review and oversight were conducted by humans. While we strive for accuracy, this content may contain errors or omissions and should be independently verified.