Tutorial Categories
Last Updated: January 29, 2026 at 19:30
GDP Demystified: Understanding the Economy’s Scoreboard - Macroeconomics Series
Ever wondered how economists, governments, and investors answer the question, “How is the economy doing?” The answer often starts with GDP—Gross Domestic Product. But GDP is more than just a number reported in the news. It’s the scoreboard of a country’s economic activity, measuring the total value of all final goods and services produced within a nation over a specific period. In this tutorial, we break down GDP from first principles: what it measures, why it exists, and its limitations.
Understanding GDP: The Heartbeat of an Economy
Imagine a small tech startup that makes a popular app. Last year, it had 100,000 downloads; this year, 120,000. Nearby, a café serves more customers, and a construction company completes a big office building. Each of these businesses is growing— but did the economy grow nationally, or is it just scattered success in a few places? GDP helps answer this question by aggregating output from every business, service, and government project across the entire country. It’s a way to see the big picture.
Understanding GDP, how it’s measured, and its strengths and limits is the first step toward making sense of the economy.
Why GDP Exists
When economists, governments, or investors ask,
“How is the economy doing?”
they need a single, consistent measure of economic activity. GDP exists to answer that. Think of it as a scoreboard in a sports match: it shows who’s ahead and by how much—but not whether the players are healthy, having fun, or whether the game is fair.
What GDP Actually Measures
GDP is: “The total value of all final goods and services produced within a country during a specific time period.”
Let’s unpack this.
1. Final Goods and Services
GDP counts only final goods and services—items ready for consumption or investment. Intermediate steps are excluded to avoid double-counting.
Example: Bread Production
- Farmer grows wheat (adds $1 of value)
- Mill turns wheat into flour (adds $2 of value)
- Bakery turns flour into bread (adds $3 of value)
- Total contribution to GDP = $6
If GDP counted wheat, flour, and bread separately, the $1 value of wheat would be counted multiple times. Counting only the final product avoids this.
Example: Digital Services
A streaming subscription involves content production, post-production, hosting, and personalization. GDP counts only the final service consumed by the user. Otherwise, we would double-count the same underlying value.
📌 Mini-Takeaway: GDP measures new economic value created, not every intermediate step.
2. Produced Within a Country
GDP measures domestic production, not ownership.
- Foreign company, domestic production: A Japanese car made in India counts toward India’s GDP, because production, jobs, and factories are in India.
- Domestic company, foreign production: An Indian IT firm providing services from Germany does not count toward India’s GDP.
Mini-Takeaway: GDP reflects economic activity within borders, not global profits of domestic companies.
3. Time Period
GDP is always measured over a specific period—quarterly or annually.
Example:
- 2023: $1 trillion produced
- 2024: $1.05 trillion produced
GDP growth tells us production increased by 5%, allowing economists to track growth, slowdowns, recessions, and recoveries.
📌 Mini-Takeaway: GDP measures production over time, giving meaning to economic trends.
What GDP Misses (The Blind Spots)
GDP is a scoreboard, not a report card on well-being.
- What GDP Counts: Factory output, retail sales, services, paid wages, corporate profits, resource extraction, formal employment, legal transactions
- What GDP Misses: Happiness, life satisfaction, income inequality, environmental damage, unpaid work (childcare, volunteering), informal/black market activity
Example: A factory increases output, raising GDP, but also pollutes heavily. Local residents may experience worse health, higher costs, and reduced quality of life. GDP does not see this.
📌 Mini-Takeaway: GDP measures the size of the economic pie, not who gets the slices or what it costs.
The Circular Flow: The Engine of Economic Activity
Before diving into calculations, visualize the economy as a circular flow between two main actors: Households and Firms.
- Households supply labor and capital to Firms, earning income (wages, profits, rent, interest).
- Firms use these resources to produce goods and services.
- Households spend their income to purchase these goods and services, which is consumption expenditure.
- This spending flows back to Firms as revenue, allowing them to pay incomes again, and the cycle repeats.
This circular flow is why we can measure the same GDP in three different ways—each a window into the same process.
Three Approaches of Calcalulating GDP: Expenditure, Income, and Production
Economists calculate GDP using three complementary approaches, each offering a different perspective on economic activity. While all three should, in theory, produce the same total, each emphasizes a different part of the economy.
1. Expenditure Approach
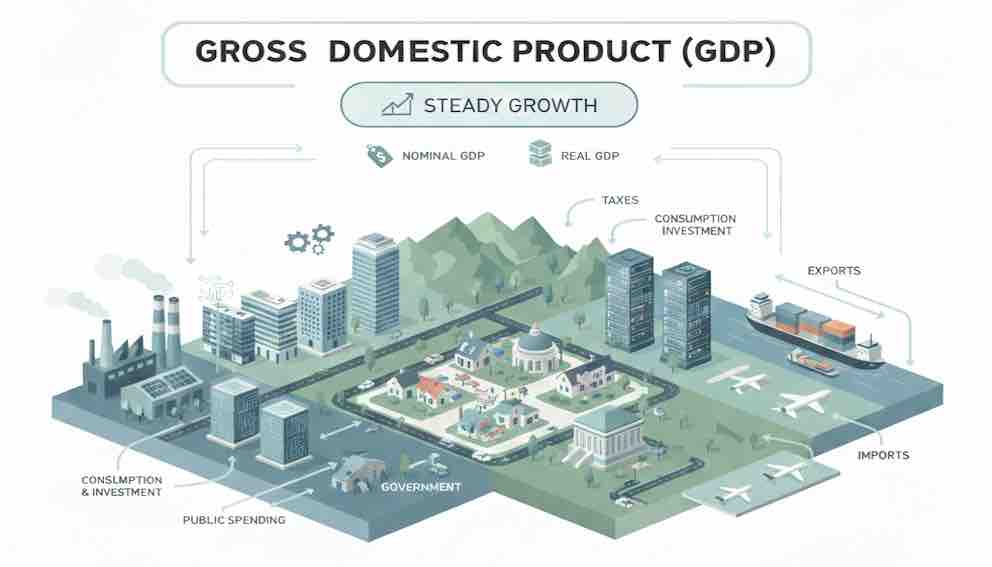
Idea: GDP can be measured as the total spending on final goods and services in the economy. Who is buying the output? This demand-side view, rooted in Keynesian economic theory, breaks GDP into four spending categories:
- C (Consumption): Household spending—groceries, rent, subscriptions, phones
- I (Investment): Business purchases of machinery, offices, technology, or inventory
- G (Government Spending): Roads, defense, teacher salaries, public services
- X − M (Net Exports): Exports minus imports
Formula:
GDP = C + I + G + (X − M)
Example: A car exported to Germany adds to GDP; a smartphone imported from China subtracts from it.
Advanced Note: This is the most commonly cited GDP figure in the media, because it closely reflects observable market transactions.
2. Income Approach
Idea: GDP can also be measured as the total income earned from production. This method looks at GDP from the income side of the economy— who earns income when goods and services are produced.
Components:
- Wages: Salaries and benefits for workers
- Profits: Earnings of companies after expenses
- Rent: Income from land or property used in production
- Interest: Earnings from lending or investments
Example:
A bakery sells a loaf of bread for $5:
- Baker → wages ($2)
- Shop owner → profit ($2)
- Landlord → rent for shop space ($1)
Advanced Note: GDP measured this way is sometimes called Gross Domestic Income (GDI).
3. Production (Value-Added) Approach
Idea: GDP can also be calculated by summing the value added at each stage of production, while avoiding double-counting intermediate goods.
Example: Bread Production
- Farmer grows wheat → adds $1 of value
- Mill turns wheat into flour → adds $2 of value
- Bakery turns flour into bread → adds $3 of value
- Total GDP contribution = $6
Why it matters: In modern economies with complex supply chains or digital services, it may be hard to identify a single final product. Measuring value added at each stage ensures GDP reflects the true contribution of every business.
📌 Mini-Takeaway: GDP is a circle of economic activity—spending generates income, income funds spending, and production creates both.
This simple loop explains why the three approaches must equal each other in theory:
Connecting the Three Methods
All three approaches measure the same GDP, but from different perspectives:
| Approach | Perspective | Example |
| Expenditure | Who buys what | Adding household spending, business investment, government, exports/imports |
| Income | Who earns what | Adding wages, profits, rent, interest |
| Production(Value-Added) | How much each firm adds | Summing value created at each stage: farmer → mill → bakery |
Key insight:
GDP is a circle of economic activity. Spending generates income, income funds spending, and production creates both.
Why the Three Measures Don’t Always Match
In theory, the three approaches to measuring GDP—expenditure, income, and production—should all give the same number. In practice, small differences often arise. Understanding these divergences helps make sense of headline GDP numbers and their revisions.
1.Data lags and revisions
Not all economic data arrives at the same time. Consumer spending and trade data may come quickly, while income statistics, corporate profits, and government receipts take longer. Early GDP estimates are therefore preliminary and often revised as more complete data comes in.
- Example: In Q1 2025, U.S. real GDP was initially reported as a –0.3% contraction. Later, after incorporating updated data on imports, consumer spending, and government activity, it was revised to –0.5%. Both numbers reflect the same underlying event—a temporary, policy-driven dip —but the revision simply shows that the contraction was slightly larger than first estimated.
2.Timing differences
GDP based on expenditure (spending by households, businesses, and government) can differ from GDP based on income (wages, profits, rents) in the short term. Temporary divergences are normal. For example: Companies may invest now but record profits later, temporarily boosting GDP relative to GDI. These differences are technical and typically disappear as full data comes in.
3. Economic shifts and one-off events
Sometimes divergences highlight real changes in economic behavior, not just measurement quirks. Short-term, policy-driven, or seasonal factors can distort quarterly GDP numbers without signaling a structural slowdown:
- Households borrowing to maintain consumption: In Q1 2025, U.S. household debt reached $18.2T. Borrowing supported consumption, so expenditure-based GDP looked strong even though income (GDI) didn’t rise as quickly. This highlighted that headline GDP growth was partly debt-driven — a nuance that spending-based GDP alone might obscure.
- Companies investing now but earning later: Expenditure-based GDP can temporarily outpace income-based GDP.
- Policy-driven shifts: Businesses rushed to import goods ahead of tariff changes in Q1 2025, boosting inventories. Imports surged (~37.9%), and because imports are subtracted in GDP, this weighed on the headline number, creating a short-term contraction.
📌 Mini-Takeaway: Divergences between GDP and GDI are not errors—they reflect timing, measurement nuances, and short-term economic shifts. Tracking revisions and understanding the context behind numbers helps distinguish temporary fluctuations from sustained changes in economic activity.
U.S. GDP by Expenditure (2024, approximate):
(All numbers are annual totals; amounts are in trillions of U.S. dollars and approximate shares of total GDP.)
| Component | Amount (approx, USD) | Share of GDP |
| Consumption (C) | ~$19.9 trillion | ~68% |
| Investment (I) | ~$5.3 trillion | ~18% |
| Government Spending (G) | ~$5.0 trillion | ~17% |
| Exports (X) | ~$3.2 trillion | ~11% |
| Imports (M) | ~$4.2 trillion | ~–14% |
| Net Exports (X − M) | ~–$1.0 trillion | ~–3% |
| Total Nominal GDP | ~$29.4 trillion | 100% |
Here’s how to interpret these components:
- C – Consumption (~68%): This is by far the largest part. It’s household spending on things like food, rent, services, and goods. Because Americans buy a lot of stuff, this drives most of the U.S. economy.
- I – Investment (~18%) : This includes business spending on equipment, buildings, technology and also residential investment (housing). It’s smaller than consumption but important for future productive capacity.
- G – Government Spending (~17%): This is public spending on services like defence, roads, education, and public workers’ wages. It’s smaller than consumption but still a major part of economic activity.
- Net Exports (X − M, ~‑3%): The U.S. imports more than it exports, so net exports subtract from GDP. That’s because imports are foreign‑produced goods and aren’t counted as domestic output.
A Very Brief Summary
- Most of U.S. GDP comes from what households buy.
- Businesses’ investment and government spending are much smaller but still significant.
- The trade balance reduces GDP because imports are greater than exports.
Nominal vs Real GDP
When you hear “GDP grew by X%” in the news, it’s important to know which GDP they mean. The distinction between nominal and real GDP tells you whether the economy is actually producing more goods and services or just seeing higher prices.
Nominal GDP
- Measures the total value of all goods and services produced using current prices.
- Can rise simply because prices go up, even if output hasn’t changed.
- Example: If the U.S. produces the same number of cars this year as last, but prices are higher, nominal GDP will grow—even though actual production stayed flat.
Real GDP
- Adjusts for inflation by using constant prices from a base year.
- Shows actual growth in production, not just rising prices.
- Example: If prices rise but the number of goods stays the same, real GDP remains flat, reflecting no real change in output.
Why it matters:
- In 2024, U.S. real GDP grew by 2.8%, meaning actual production of goods and services increased by that amount.
- At the same time, overall prices (GDP price index) rose ~2.4%.
- Nominal GDP would appear to have grown roughly 5.2% (2.8% + 2.4%), but that figure mixes real production growth and price increases.
📌 Mini-Takeaway: Real GDP tells us how much the economy is truly producing, while nominal GDP can be misleading if prices are rising. Policymakers and analysts focus on real growth to understand changes in output and living standards.
The GDP Deflator — A Broad Price Measure
The GDP deflator gives a comprehensive view of inflation across the entire economy, helping policymakers separate price changes from actual output growth.
To adjust nominal GDP for inflation, economists use the GDP deflator:
GDP Deflator=NominalGDP/Real GDP×100
- Unlike CPI, which tracks a fixed basket of consumer goods, the GDP deflator measures all goods and services produced domestically.
- Imported price spikes affect GDP deflator less directly than CPI
- It is broader: includes business investment, government spending, and exports.
- Its basket changes every year based on current production, unlike CPI’s fixed basket.
Why it matters:
- CPI shows how households experience price changes, while the GDP deflator shows economy-wide inflation.
- Example: If imported oil prices spike, CPI rises sharply (because consumers pay more), but the GDP deflator may not change as much, highlighting that internal production costs aren’t rising at the same pace.
📌 Mini-Takeaway:
- Nominal GDP mixes output and price changes.
- Real GDP strips out price effects to show actual production.
- GDP Deflator measures broad economy-wide inflation.
- CPI measures consumer-experienced inflation.
GDP Growth vs Economic Health
GDP growth is a headline figure, but it doesn’t tell you everything about the quality or sustainability of an economy’s performance.
When you hear GDP grew 3%, it’s easy to assume households are thriving. But GDP measures total output, not whether families have more money in their pockets or sustainable finances.
Take consumption—the engine that has powered ~70% of U.S. GDP for decades. Strong spending makes growth look healthy, but where's that money coming from?
In the earlier example we talked about how household debt reached record levels of about $18.2 trillion in the US in early 2025. This borrowing supported consumption — which drives roughly two-thirds of the U.S. GDP — helping headline numbers appear strong. But this debt growth raises important questions: are all households benefiting equally? Are repayments manageable if income growth slows?
Similarly, government borrowing can temporarily boost GDP. U.S. national debt in 2025 is estimated at around $38 trillion, roughly 100% of GDP. Short-term spending programs can lift output, but if revenue doesn’t keep pace, debt accumulation may crowd out future investment, increase interest burdens, and raise long-term fiscal risks.
📌 Mini-Takeaway:
Always ask: Is growth real, sustainable, and broadly shared? Is it debt-driven or temporary? Is there real prosperity?
Advanced Adjustments: Per Capita, PPP, and Potential Output
To move from basic GDP to a sophisticated understanding of economic health and living standards, these advanced concepts are essential.
GDP Per Capita
GDP measures total production, but it doesn’t account for population size. To understand economic output per person, economists use GDP per capita:
GDP per capita = GDP ÷ population
This adjustment gives a better sense of living standards. For example:
- The U.S. and China have enormous total GDPs, but their per-person output is more moderate compared with smaller, high-productivity countries.
- Small, highly productive countries can have high GDP per capita even if total GDP is modest.
📌 Mini-Takeaway:
GDP per capita helps show whether the average person is actually getting wealthier, not just the economy as a whole.
Purchasing Power Parity (PPP): The “Cost-of-Living” Fix
When we compare countries using GDP per person, just looking at the market exchange rate can be misleading. That’s because $1 doesn’t buy the same amount of stuff everywhere.
- For example, $1 can buy a lot more in Vietnam than in Norway.
- So if we just convert GDP using current exchange rates, we might underestimate how much people in cheaper countries can actually buy.
How PPP fixes this:
- Instead of using the real-world market exchange rate, PPP uses a “special” exchange rate.
- This rate makes sure that the same basket of goods costs the same in every country.
- In other words, PPP adjusts GDP to show what people can really afford to buy, not just the number in dollars.
Example (2023, World Bank):
- India’s GDP per person using market exchange rates: ~$2,600
- India’s GDP per person using PPP: ~$8,400
The PPP number is higher because things are cheaper in India, so $1 goes further. It gives a more realistic picture of living standards.
Potential GDP & The Output Gap
While Real GDP tells us what an economy did produce, Potential GDP estimates what it could produce at full, non-inflationary capacity—using all available labor, capital, and technology efficiently.
Output Gap: Actual GDP − Potential GDP
- A negative output gap (Actual < Potential) indicates unused resources and a sluggish economy, often associated with recessions and unemployment.
- A positive output gap (Actual > Potential) means the economy is "overheating," straining resources and typically creating inflationary pressures.
- Why it's crucial: This framework shifts the question from "Is GDP growing?" to "Is GDP growing sustainably at its potential?" It helps distinguish between healthy recovery growth (closing a negative gap) and unsustainable, inflationary booms.
GDP and Recessions
GDP measures the total output of an economy. When real GDP falls, it means the economy is producing less overall, which can trigger a chain reaction: businesses may cut back or lay off workers, households may spend less, and investment can slow. In short, a declining GDP often signals that the economy is contracting, and prolonged contractions are what we call recessions. While two consecutive negative quarters often signal a recession, but technically, they are dated by bodies like NBER (US) or ONS (UK) based on broader indicators like employment, income, etc (not just GDP).
Not every dip in GDP reflects a broad economic problem. For instance, in Q1 2025, U.S. GDP fell by −0.3% (annualized). Much of this drop was due to temporary factors, such as companies importing inventory ahead of tariffs—production itself wasn’t slowing sharply. Similarly, during COVID-19, GDP plummeted in certain quarters because of sudden shutdowns, but bounced back as activity resumed.
GDP fluctuations reflect real changes in production, but short-term dips must be interpreted through the lens of Potential GDP. A quarter of negative growth may simply be a return to a sustainable trend after a period of overheating (a positive output gap), not the start of a damaging recession (a deepening negative output gap). Similarly, understanding whether inflation stems from demand (closing a positive gap) or supply shocks is clarified by comparing CPI and the GDP Deflator.
📌 Mini-Takeaway: GDP fluctuations reflect real changes in production, but short-term dips can also be influenced by temporary or technical factors. Understanding these nuances helps separate short-term noise from genuine economic weakness.
Interpreting GDP in Context
GDP is powerful when interpreted alongside context. Alone, it can mislead.
Some Key Questions To ask when looking at GDP data:
- Is growth real or nominal?
- Does income growth support spending?
- Is growth evenly distributed across households and sectors?
- Are short-term factors affecting numbers?
- Are trends sustainable for the long term?
As you explore these questions, you’ll learn to read beyond the headline number and understand what kind of growth is real, and what might be short-term noise. This curiosity is the heart of good economic interpretation — looking for the context behind the story the numbers are trying to tell.
📌 Mini-Takeaway: GDP is a tool, not a verdict on well-being. Context reveals the real story.
Summary: GDP in a Nutshell
- Measures total domestic production over time
- Focuses on final goods/services to avoid double-counting
- Can be measured via expenditure, income, or production
- Real GDP adjusts for inflation using the GDP deflator
- GDP per capita adjusts for population
- GDP growth can be misleading if fueled by debt, temporary factors, or concentrated gains
- PPP adjustments help compare living standards internationally
Think of GDP as the scoreboard of an economy. It shows trends and scale. Used in isolation, GDP can misrepresent economic conditions. Used in context, it becomes a powerful analytical framework. Once you understand it and learn to place it in context, economic headlines stop feeling abstract.
You begin to see structure instead of noise.
References
- Mankiw, N. Gregory. Principles of Economics (9th edition). Cengage, 2021.
- Blanchard, Olivier, and Johnson, David R. Macroeconomics (8th edition). Pearson, 2017.
- U.S. Bureau of Labor Statistics (BLS). Employment Situation Reports. https://www.bls.gov/news.release/empsit.nr0.htm
- U.S. Bureau of Economic Analysis (BEA). Gross Domestic Product (GDP) Data. https://www.bea.gov/data/gdp/gross-domestic-product
- Federal Reserve Board. Monetary Policy Reports & Historical Rate Decisions. https://www.federalreserve.gov/monetarypolicy.htm
- International Monetary Fund (IMF). World Economic Outlook Reports. https://www.imf.org/en/Publications/WEO
About Swati Sharma
Lead Editor at MyEyze, Economist & Finance Research WriterSwati Sharma is an economist with a Bachelor’s degree in Economics (Honours), CIPD Level 5 certification, and an MBA, and over 18 years of experience across management consulting, investment, and technology organizations. She specializes in research-driven financial education, focusing on economics, markets, and investor behavior, with a passion for making complex financial concepts clear, accurate, and accessible to a broad audience.
Disclaimer
This article is for educational purposes only and should not be interpreted as financial advice. Readers should consult a qualified financial professional before making investment decisions. Assistance from AI-powered generative tools was taken to format and improve language flow. While we strive for accuracy, this content may contain errors or omissions and should be independently verified.