Tutorial Categories
Last Updated: January 31, 2026 at 19:30
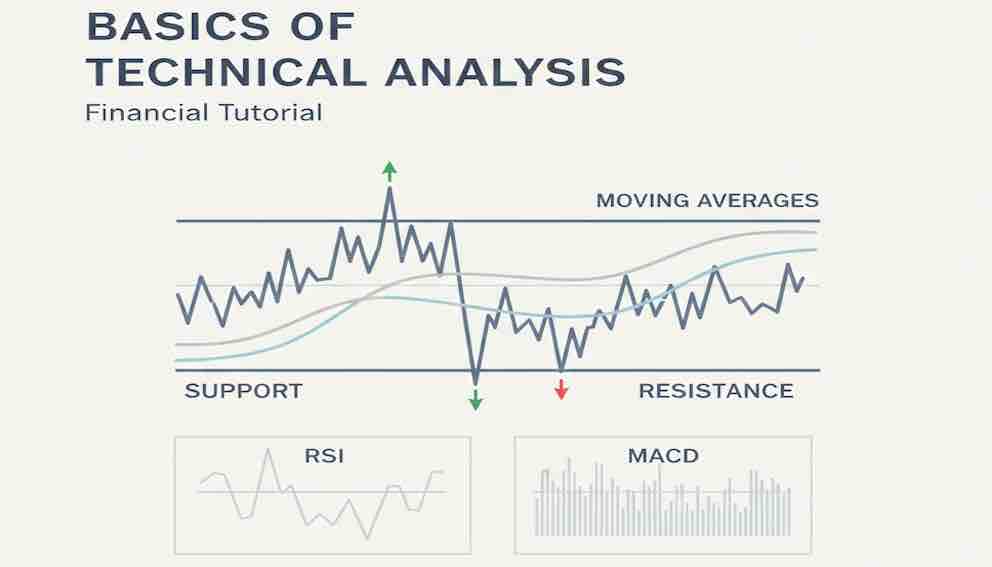
Basics of Technical Analysis: A Beginner’s Guide to Reading Charts, Identifying Trends, and Using Indicators - Introduction to Investing
Charts aren't magic—they're a visual history of market psychology. This guide teaches you to read this story: identify trends (bullish/bearish sentiment), spot key price levels (support/resistance), and use simple indicators like RSI to gauge market greed or fear. Learn how to use these tools to improve your entry timing for long-term investments and avoid common traps. You'll gain a practical lens on market behaviour, not a crystal ball.
Introduction: The Market's Emotional EKG
You've learned to evaluate a company's health (fundamental analysis). Now, let's learn to take the market's pulse. Technical Analysis (TA) isn't about predicting the future; it's the study of past price action to understand current market psychology.
Think of a price chart as an emotional EKG for the crowd of buyers and sellers. The squiggles tell a story of fear, greed, optimism, and panic. By learning to read this chart, you can:
- Make more disciplined decisions about when to add to a long-term investment.
- Understand if a sudden drop is a normal pullback or a change in trend.
- Remove some guesswork from your timing.
Let's learn this visual language by following the chart of a familiar company, "TechGiant Inc."
Part 1: The Chart – Your Map of Market Psychology
The Philosophy: TA operates on one core idea: All known information (news, earnings, sentiment) is reflected in the current price. The chart is the clearest record of how that information was digested by the market.
Candlestick Charts – The Best Tool for Beginners:
Forget line charts for now. A candlestick is a rich data point:
- The Body: Shows the opening and closing price range.
- Green/White Body: Closed higher than it opened (bullish for the period).
- Red/Black Body: Closed lower than it opened (bearish for the period).
- The Wicks (Shadows): Show the highest and lowest prices reached during the period (a day, an hour).
- What it tells you: A long green body with small wicks shows strong, sustained buying pressure. A small body with long wicks shows indecision—a fight between buyers and sellers.
Choosing Your Timeframe: The Right Lens
- Daily/Weekly Charts: Best for long-term investors. They smooth out daily noise and show the major trend. A weekly chart showing an uptrend is far more significant than a 5-minute chart.
- Hourly/Intraday Charts: Used by short-term traders. For beginners focusing on long-term wealth, stick to daily or weekly charts to avoid distraction and false signals.
Part 2: The Big Picture – Identifying the Trend
The trend is the single most important thing on the chart. Is the crowd optimistic or pessimistic?
- Uptrend (Bullish Mood): The chart makes Higher Highs (HH) and Higher Lows (HL). Think of a staircase going up. TechGiant's chart has been doing this for months.
- Downtrend (Bearish Mood): The chart makes Lower Highs (LH) and Lower Lows (LL). A staircase going down.
- Sideways/Range (Indecisive Mood): Price bounces between two horizontal levels. The crowd is confused, waiting for new information.
Your #1 Rule: "The trend is your friend." It's easier to swim with the current. For long-term investing, adding to positions during a healthy uptrend is far safer than trying to catch a falling knife in a downtrend.
Part 3: Key Levels – The Market's Memory (Support & Resistance)
Prices don't move randomly. They react at levels the market remembers.
- Support: A price level where buying tends to appear. It's like a price floor. TechGiant's stock has bounced off £150 three times. The market remembers: "At £150, this feels like a good deal."
- Resistance: A price level where selling tends to appear. It's like a price ceiling. TechGiant keeps failing to break above £200. The market thinks: "At £200, it's time to take profits."
How to Use This:
- For buying: Look to add to a position near support in an uptrend. You're buying on a temporary dip in sentiment.
- For selling/taking profits: Consider it near resistance. You're selling into temporary optimism.
- Breakouts & Breakdowns: When price decisively closes above resistance or below support, it signals a potential shift in psychology and a new trend may be starting.
Part 4: Volume – The Market's Heartbeat
Volume (the number of shares traded) is critical. It tells you whether a price move has conviction or is just noise.
- High Volume Breakout/Breakdown: A move above resistance or below support on high volume is a strong, believable signal. Many participants agree with the move.
- Low Volume Move: A price change on thin volume is suspect. It may reverse quickly because few traders are committed to it.
- Your Takeaway: Volume confirms price. A bullish signal with rising volume is more trustworthy.
Part 5: Simple Indicators – Gauging Greed and Fear
Indicators are calculations that help quantify the market's mood. Use them to confirm what the price and trend are telling you.
1. Moving Averages: The Trend Smoothie
- What it is: A line that averages past prices, smoothing out the noise.
- How to use it:
- The 200-Day Simple Moving Average (SMA): The "long-term sentiment" line. Price above it = long-term bullish bias. Price below it = long-term bearish bias.
- The 50-Day SMA: The "medium-term trend" line.
- The "Golden Cross": 50-day SMA crosses above 200-day SMA. A classic long-term bullish signal.
- The "Death Cross": 50-day SMA crosses below 200-day SMA. A classic long-term bearish warning.
2. Relative Strength Index (RSI): The Greed & Fear Gauge
- What it is: An oscillator from 0 to 100 measuring the speed of price moves.
- How to use it (The Simple Rules):
- RSI above 70 = "Overbought." The market might be getting greedy/exhausted. Not a sell signal, but a warning not to chase buys.
- RSI below 30 = "Oversold." The market might be getting fearful/panicked. Not a buy signal, but a warning not to panic sell.
- *TechGiant's RSI hitting 75 suggests it's overbought in the short-term—maybe wait for a pullback to add.*
3. MACD: The Momentum Shifter
- What it is: Shows the relationship between two moving averages. Focus on the histogram (the bars).
- How to use it: When the bars are above the zero line and getting taller, uptrend momentum is strong. When bars are below zero and getting deeper, downtrend momentum is strong. A flip from negative to positive bars can signal a shift in momentum.
Part 6: Putting It Together – A Beginner's Practical Framework
Never use one indicator in isolation. The power of TA is in confluence—getting multiple signals to align. Before considering a trade, run this checklist.
The 3-Step Confluence Check:
- What's the TREND? (Look at the chart & 200-day SMA). Only trade in the direction of the major trend.
- Where is the PRICE? (Is it at a key Support or Resistance level?)
- What's the CONFIRMATION? (Do the indicators and volume agree?)
-Ideal Bullish Confluence: Price at support in an uptrend + RSI oversold (or rising from it) + MACD histogram turning up + volume increasing on the bounce.
-Ideal Bearish Confluence: Price at resistance in a downtrend + RSI overbought + MACD histogram turning down + volume increasing on the drop.
Example: Should you buy TechGiant?
- Trend: Uptrend on weekly chart. ✅
- Price: Pulling back to the £150 support level. ✅
- Confirmation: RSI is at 35 (near oversold), MACD bars are shrinking but still positive, volume is steady. ⚠️ (Good, but not perfect confluence).
- Conclusion: The weight of evidence is decent for a planned buy near £150 support. This is not a guarantee, but a disciplined way to plan an entry.
A Note on Chart Patterns:
As you advance, you'll learn common patterns like Head & Shoulders (reversal) or Triangles (continuation). For now, just know they exist—they are recognisable shapes on the chart that reflect repeating crowd psychology. Your first focus should be mastering trends, support/resistance, and the basic indicators above.
Part 7: Risk Management – Your Essential Safety Gear
TA is useless without rules to protect your capital. If you use TA to guide an entry, you must also plan your exit if you're wrong.
- The Stop-Loss: Decide before you buy where you will sell to limit your loss if the trade goes against you. A logical place is just below the support level you're buying at. If £150 is support, a stop at £145 limits your risk.
- Position Sizing: Never bet a large portion of your portfolio on one technical setup. Even the best-looking chart can fail.
Conclusion: TA is a Lens, Not a Crystal Ball
Technical analysis won't tell you what to buy (that's fundamental analysis). It helps you with when and how to engage with the market you're in.
Its Real Power: It provides a disciplined, risk-aware framework to make decisions, reducing emotional, impulsive trades. It turns "I feel like buying" into "The trend is up, price is near support with volume, RSI is neutral, so my plan says I can add with a stop-loss here."
Its Fatal Flaws (Remember These!):
- Self-Fulfilling Prophecy: It works because many people see the same levels.
- Sudden News Trumps Everything: An earnings bomb will vaporize any pretty chart pattern.
- Analysis Paralysis: You can find a conflicting signal if you look hard enough.
Use TA as one tool in your kit. For your core long-term holdings, let the fundamentals guide you. Use TA like a seasoned sailor uses the wind and instruments—to tactically adjust your sails on a long voyage, not to change your destination. Start with the daily and weekly charts, seek confluence, and always, always use a stop-loss.
About Swati Sharma
Lead Editor at MyEyze, Economist & Finance Research WriterSwati Sharma is an economist with a Bachelor’s degree in Economics (Honours), CIPD Level 5 certification, and an MBA, and over 18 years of experience across management consulting, investment, and technology organizations. She specializes in research-driven financial education, focusing on economics, markets, and investor behavior, with a passion for making complex financial concepts clear, accurate, and accessible to a broad audience.
Disclaimer
This article is for educational purposes only and should not be interpreted as financial advice. Readers should consult a qualified financial professional before making investment decisions. Assistance from AI-powered generative tools was taken to format and improve language flow. While we strive for accuracy, this content may contain errors or omissions and should be independently verified.