Tutorial Categories
Last Updated: May 19, 2026 at 10:30
Total Factor Productivity Explained: How Technology and Efficiency Drive Economic Growth Beyond Machines and Workers
Why Some Countries Grow Richer While Others Stall — And What Productivity Really Means
This tutorial explores one of the most important yet misunderstood concepts in macroeconomics: Total Factor Productivity, or TFP. Unlike capital or labor, which are easy to count, TFP captures the mysterious residual that makes some economies grow faster than others even when they have the same machines and workers. You will learn how economists decompose growth into its contributing parts, why the Solow residual surprised everyone by being so large, and what real-world events like the productivity slowdown of the 1970s and the IT boom of the 1990s teach us about the role of technology. By the end, you will understand that a nation's prosperity depends not just on how much it invests, but on how well it uses what it already has.
Introduction: The Puzzle of Two Identical Factories
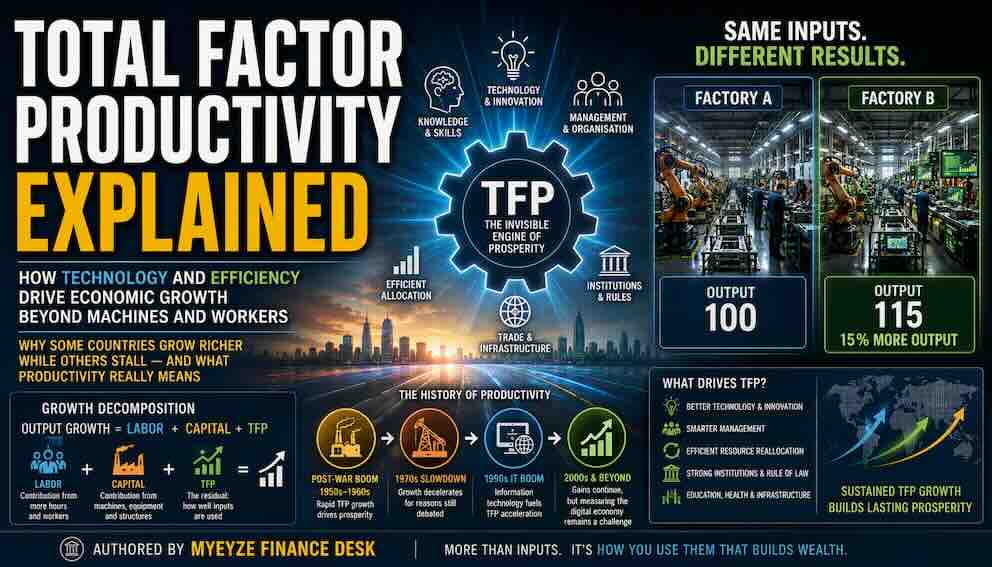
Imagine two factories side by side. Both have the same number of workers. Both have the same machines, same computers, same raw materials. Both run for the same number of hours. Yet one factory produces fifteen percent more output than the other. How is this possible?
You cannot see the difference by walking through the factory floors. The extra output does not come from more labor or more capital, because those are identical. It comes from something invisible: the way workers and machines are organised, the knowledge they bring to their tasks, the efficiency of the production process, and the technology embedded in their routines.
This invisible factor is what economists call Total Factor Productivity, often abbreviated as TFP. It is the part of economic growth that cannot be explained by increases in labor or capital alone. Some people call it the measure of our ignorance, because it captures everything we have not explicitly measured. A more generous description is that TFP measures how well an economy transforms inputs into outputs. It is the intelligence embedded in a nation's way of doing things.
Understanding TFP matters enormously for real-world policy. A country that doubles its factories and doubles its workforce will not necessarily double its output if its productivity is stagnant. Conversely, a country with modest investment but rapidly improving productivity can outgrow a capital-heavy rival. This tutorial will walk you through what TFP means, how economists measure it, what the historical data shows, and why technology is only part of the story.
From the Solow Model to the Residual That Changed Everything
Recall from the previous tutorial that the Solow model teaches a crucial lesson: capital alone cannot sustain growth because of diminishing returns. Adding more machines eventually yields smaller and smaller increases in output, and without technological progress an economy will settle into a steady state where growth stops. That is why the Solow model points to technology as the ultimate source of long-run growth. But for decades, technology was treated as a black box — something that just happened.
In 1957, a striking empirical finding upended this comfortable view. When economists measured how much of US economic growth between 1909 and 1949 could be explained by increases in capital and labor, the result was astonishing: only about one-eighth of the increase in output per worker could be accounted for by more capital per worker. The remaining seven-eighths was a mystery. It was a residual — the part of growth left over after subtracting the measurable contributions of labor and capital. This became known as the Solow residual.
Some economists thought this must be a mistake. Perhaps capital had been mismeasured. Perhaps education or health should be counted as a form of capital. But subsequent research, using ever more sophisticated methods, consistently found that a large share of growth remains unexplained by measurable inputs. The residual was real. It is now called Total Factor Productivity.
What does this residual represent? Over decades of research, economists have filled in some of the ignorance it once captured. TFP reflects technological progress, improvements in worker skills not captured by simple headcounts, better management practices, more efficient allocation of resources across firms, gains from trade, and improvements in infrastructure that make the whole economy run more smoothly. In short, TFP is the efficiency with which an economy turns its inputs into useful output. A later tutorial in this series explores the theoretical foundations of where TFP comes from — why some economies generate it faster than others and what policy can do to encourage it. Here, we focus on what TFP is, how it is measured, and what history teaches us about its behaviour.
Growth Decomposition: Breaking the Numbers Apart
To make TFP concrete, we need to understand how economists actually calculate it. The process is called growth decomposition or growth accounting. It takes the total growth rate of an economy and splits it into three pieces: the contribution from labor, the contribution from capital, and the residual that is TFP.
Imagine a country whose output grows by five percent in a single year. To decompose that growth, an economist would first ask how much labor grew. Suppose the number of hours worked increased by one percent. But not all labor contributes equally to output. Historically, labor's share of national income has been about two-thirds, while capital's share has been about one-third. These shares are not arbitrary. They come from the fact that in most economies, wages account for roughly two-thirds of total income and profits account for the remaining third.
The contribution of labor to growth is therefore the growth rate of labor multiplied by labor's share: 0.67 percent. Next, the economist asks how much capital grew. Suppose the capital stock increased by six percent. The contribution of capital is the growth rate of capital multiplied by capital's share of one-third: about two percentage points.
Adding these together, labor contributed 0.67 percentage points and capital contributed 2 percentage points, summing to 2.67 percentage points. But total output grew by five percentage points. The remaining 2.33 percentage points are the Solow residual — TFP growth. Something other than more labor and more capital caused output to rise.
This residual can be positive or negative. Negative TFP growth means the economy is becoming less efficient at using its inputs. That can happen during wars, economic collapses, or periods of severe policy mismanagement. Positive TFP growth means the economy is finding better ways to produce.
A Necessary Caveat: The Difficulty of Measuring TFP
Before examining historical examples, it is important to acknowledge that TFP is remarkably difficult to measure precisely. The residual captures everything not yet measured, including measurement errors in labor and capital themselves. If capital growth is underestimated, TFP growth will be overestimated. If labor quality is mismeasured, the residual absorbs that error. Whenever you encounter a TFP estimate, you are looking at a constructed number surrounded by genuine uncertainty, not a precise fact.
Consider the challenge of measuring output in services. How do you measure the output of a teacher, a doctor, or a software engineer? For a factory making cars, output is easy to count. For a school, output is the increase in student knowledge, which is not directly observable. If test scores rise because of grade inflation rather than real learning, measured output rises even if actual productivity is flat. This is why TFP in services is notoriously hard to estimate.
Measuring capital quality is equally difficult. A computer today is far more powerful than one from ten years ago, but counting computers as equivalent machines misses this quality improvement entirely. Modern growth accounting tries to adjust for quality through hedonic pricing, estimating what a computer's features would have cost in a base year. These adjustments are imperfect.
There is also a live debate about whether TFP has genuinely slowed since 2005 or whether we are failing to capture the value of free digital goods. Services like Google Maps, Wikipedia, and social media provide enormous value that does not appear in GDP because consumers pay nothing for them. If that value could be measured, estimated TFP growth might look considerably higher. This debate remains unresolved.
The practical implication is that broad patterns in TFP — the post-war boom, the 1970s slowdown, the 1990s acceleration — are robust across different measurement approaches. The exact magnitude of TFP growth in any given year is not. Keep this caveat in mind as we examine the historical record.
The Productivity Slowdown of the 1970s
One of the most puzzling events in modern economic history is the productivity slowdown that began around 1973. For the first quarter century after World War II, the United States and other rich countries enjoyed rapid TFP growth, often exceeding two percent per year. Then, suddenly and for reasons economists still debate, TFP growth fell by half or more and stayed low for nearly two decades.
What happened? The oil price shocks of 1973 and 1979 were part of the story, but they do not fully explain a slowdown that lasted until the early 1990s. Some economists pointed to a decline in innovation after the great post-war wave of inventions including jet engines, plastics, and electronics. Others blamed measurement problems: perhaps TFP was still growing but shifting into services, where output is harder to measure. Still others argued that environmental and workplace safety regulations, while valuable, diverted resources away from productive investment.
One of the most influential explanations comes from the economist Robert Gordon. Gordon argues that the great inventions of the late nineteenth and early twentieth centuries — electricity, the internal combustion engine, indoor plumbing, the telephone, and modern sanitation — were uniquely transformative. Those innovations reshaped every aspect of daily life in ways that later inventions, including information technology, simply cannot match. From Gordon's perspective, the productivity slowdown of the 1970s was not a temporary aberration but a return to a more normal, slower rate of progress after an extraordinary century of innovation. This is a deeply contested view — optimists point to artificial intelligence and biotechnology as the next great wave — but it forces a serious question: what if the rapid productivity growth of the mid-twentieth century was the exception rather than the rule?
The slowdown mattered enormously for ordinary people. If TFP had continued growing at its pre-1973 rate, the average American worker would earn roughly thirty percent more today than they actually do. That is the power of productivity compounding over decades. A small change in the annual growth rate, sustained over many years, transforms living standards. The productivity slowdown also taught economists an important lesson: TFP is not a smooth, predictable force. It can accelerate and decelerate for reasons we only partially understand, which means policymakers who assume a constant productivity growth rate are setting themselves up for surprises.
The Information Technology Boom of the 1990s
Just as the productivity slowdown was beginning to feel permanent, something changed. Starting in the mid-1990s, TFP growth in the United States accelerated sharply, returning to levels last seen in the 1950s and 1960s. The primary driver was information technology.
The 1990s saw the widespread adoption of personal computers, the commercial internet, bar code scanners, and supply chain management software. Unlike earlier waves of automation, which mainly affected manufacturing, information technology transformed retail, finance, wholesale trade, and logistics. Walmart's supply chain system allowed the company to track inventory in real time, reducing capital tied up in warehouses and ensuring shelves were stocked efficiently. That is pure TFP growth: the same number of trucks and workers moving more goods.
It is important to be precise about what happened and what did not. Most of the productivity acceleration was concentrated in a remarkably small number of sectors. The biggest gains came from IT-producing industries themselves and from IT-intensive retail and wholesale trade, where a handful of large firms led the way. Healthcare, construction, education, and most other services saw much more modest improvements. This concentration matters because it tempers the narrative that information technology broadly transformed everything. It transformed some things enormously and others barely at all.
The IT boom also demonstrated that technology alone is not sufficient. For TFP to rise, firms must reorganise their production processes to take advantage of new tools. Buying computers achieves nothing if workers use them as typewriters. The productivity gains of the 1990s came from complementary changes: retraining workers, redesigning workflows, and replacing management practices that could not adapt. This is why TFP growth often lags behind technological invention by a decade or more. Learning to use a new technology effectively takes time.
By the early 2000s, the IT boom had faded, but it left behind a permanently higher level of productivity. The American economy in 2005 could produce significantly more with the same inputs than it could in 1990. That is the enduring legacy of a period of rapid TFP growth.
Technology Is Not the Whole Story: Management, Reallocation, and Institutions
It is tempting to equate TFP with technology, and many introductory treatments do exactly that. But this is too narrow. Technology is the most important driver of TFP over the long run, but three other factors deserve serious attention: management quality, the reallocation of resources across firms, and the quality of institutions.
Consider management quality. Studies comparing factories around the world have found enormous productivity differences even when factories have identical machines and workers with similar education. The difference was management. Factories using lean production techniques, inventory tracking, performance incentives, and regular worker training produced far more output than those that did not. These management practices are a form of knowledge that can be learned and copied, but the diffusion is slow. Countries with better average management quality have higher TFP.
Consider the distinction between within-firm and between-firm productivity growth. A significant share of aggregate TFP growth comes not from individual firms becoming more efficient but from market share shifting toward more productive firms and away from less productive ones. When a highly productive firm grows and a less productive firm shrinks or fails, average productivity rises even if no single firm changes its practices. The policy implication is important: competition policy that makes it easy for new firms to enter and difficult for inefficient firms to survive through subsidies or protection can raise aggregate TFP substantially.
Consider institutions. The economists Daron Acemoglu and James Robinson have argued that the fundamental driver of long-run TFP differences across countries is institutional quality. In their framework, inclusive institutions — those that enforce property rights broadly, encourage investment, allow entry of new firms, and provide public education — generate sustained productivity growth. Extractive institutions — those that concentrate power in a small elite, suppress competition, and protect incumbents — do not. This argument helps explain why countries like South Korea and Botswana grew rapidly while Zimbabwe and Venezuela stagnated despite similar starting conditions. Infrastructure matters too, though it blurs the line between capital and TFP. Reliable electricity, paved roads, and honest courts all raise the efficiency with which existing inputs are used.
So when you hear economists talk about TFP, remember that they are describing a broad category: everything that makes an economy more efficient at turning inputs into outputs, except the simple accumulation of more inputs. Technology is the largest and most celebrated part of that category, but management, resource reallocation, and institutions matter enormously as well.
Growth Decomposition in Practice: The Case of China
To see how growth decomposition works in practice, consider China's economic miracle. Between 1980 and 2010, China grew at an average rate of nearly ten percent per year — one of the fastest sustained growth episodes in recorded history. What drove it?
When economists decomposed China's growth, they found a mix of capital accumulation, labor reallocation, and productivity improvement. A large share came from capital accumulation: China invested an enormous portion of its output in factories, roads, ports, and power plants. Another significant share came from structural transformation: tens of millions of workers moved from low-productivity agriculture to higher-productivity manufacturing and services. This reallocation of labor is itself a form of productivity gain, though it is typically counted separately from TFP.
What about TFP specifically? Most serious estimates suggest that TFP growth contributed roughly thirty to forty percent of China's total growth during the boom years, with capital accumulation and labor reallocation doing most of the remaining work. China's miracle was therefore not primarily a TFP miracle. It was an investment and structural transformation miracle, with TFP playing an important but supporting role. Chinese firms did become better at using their inputs over time, adopting foreign technology through joint ventures, absorbing management practices from multinational corporations, and benefiting from competition as trade barriers fell.
In recent years, China's TFP growth has slowed. Most economists argue that China has exhausted the easiest sources of productivity gain: moving workers from farms to factories, copying foreign technology, and building basic infrastructure. Sustaining growth now requires generating domestic innovation and improving the efficiency of state-owned enterprises — a considerably harder transition. China's experience illustrates a broader truth: TFP is not a fixed national characteristic. It can rise rapidly during catch-up growth but sustaining it requires continuous institutional and technological improvement.
The Difference Between TFP and Labor Productivity
A common source of confusion is the difference between Total Factor Productivity and labor productivity. Labor productivity is simply output per hour worked — easy to calculate and easy to understand. TFP is more abstract. But the distinction matters greatly for policy.
Labor productivity can increase for two distinct reasons. First, workers can have more capital to work with. A construction worker with a bulldozer produces more than one with a shovel, even if both work equally hard. This is capital deepening. Second, workers can become more efficient at using both capital and labor together. That is TFP.
If a country raises labor productivity by giving workers more machines, that growth is costly — it requires saving today to invest in those machines, sacrificing current consumption. If a country raises labor productivity through TFP improvement, the same inputs simply produce more output. This is why economists pay particular attention to TFP growth. It is the closest thing to a free lunch in macroeconomics.
A careful qualification is worth making here. TFP growth is not literally costless. Improving TFP often requires real investment — in research and development, education, training, and organisational change. A firm adopting new management practices must spend time and money retraining workers. A country improving its institutions must invest in legal reform and anti-corruption enforcement. The sense in which TFP growth resembles a free lunch is that once the underlying knowledge exists, applying it does not use it up. That is what makes knowledge fundamentally different from physical capital — a distinction we explore fully in the tutorial on endogenous growth theory.
Conclusion: The Silent Engine of Prosperity
Total Factor Productivity is not a household name. You will rarely hear it in political speeches or news headlines. Yet it is one of the most powerful forces shaping living standards over the long run. Unlike capital accumulation, which requires sacrificing consumption today for gain tomorrow, TFP improvement raises output with much less present sacrifice once the underlying knowledge exists. Unlike labor force growth, which faces demographic limits, TFP growth has no obvious ceiling. A nation that steadily improves its TFP can grow richer for generations.
The history of TFP is a history of uncertainty as much as discovery. The productivity slowdown of the 1970s showed that advanced economies can stagnate for decades, and Robert Gordon's argument forces us to take seriously the possibility that the great age of transformative innovation may not automatically repeat itself. The IT boom of the 1990s showed that rapid acceleration is possible, though the gains were concentrated in a few sectors rather than spread evenly across the economy. China's experience shows that catch-up growth through adopting existing technology and moving workers into higher-productivity activities can be dramatic, but sustaining it requires building the institutional and innovative capacity to generate new ideas domestically. Japan and Italy show that protecting inefficient firms from competition can permanently suppress TFP.
For readers who want to think like an economist, TFP offers a valuable mental habit. Whenever you see a country grow rapidly, ask how much of that growth comes from more inputs and how much from using inputs better. Whenever you see a country struggle, ask whether the problem is too little investment or too little productivity. And whenever you hear a politician promise prosperity through building more things, remember that how you build matters as much as how much you build. The invisible factor — the organisation, the efficiency, the quality of institutions, the knowledge embedded in a nation's way of doing things — is often the difference between economies that flourish and those that merely accumulate.
About Swati Sharma
Lead Editor at MyEyze, Economist & Finance Research WriterSwati Sharma is an economist with a Bachelor’s degree in Economics (Honours), CIPD Level 5 certification, and an MBA, and over 18 years of experience across management consulting, investment, and technology organizations. She specializes in research-driven financial education, focusing on economics, markets, and investor behavior, with a passion for making complex financial concepts clear, accurate, and accessible to a broad audience.
Disclaimer
This article is for educational purposes only and should not be interpreted as financial advice. Readers should consult a qualified financial professional before making investment decisions. Assistance from AI-powered generative tools was taken to format and improve language flow. While we strive for accuracy, this content may contain errors or omissions and should be independently verified.