Tutorial Categories
Last Updated: February 2, 2026 at 10:30
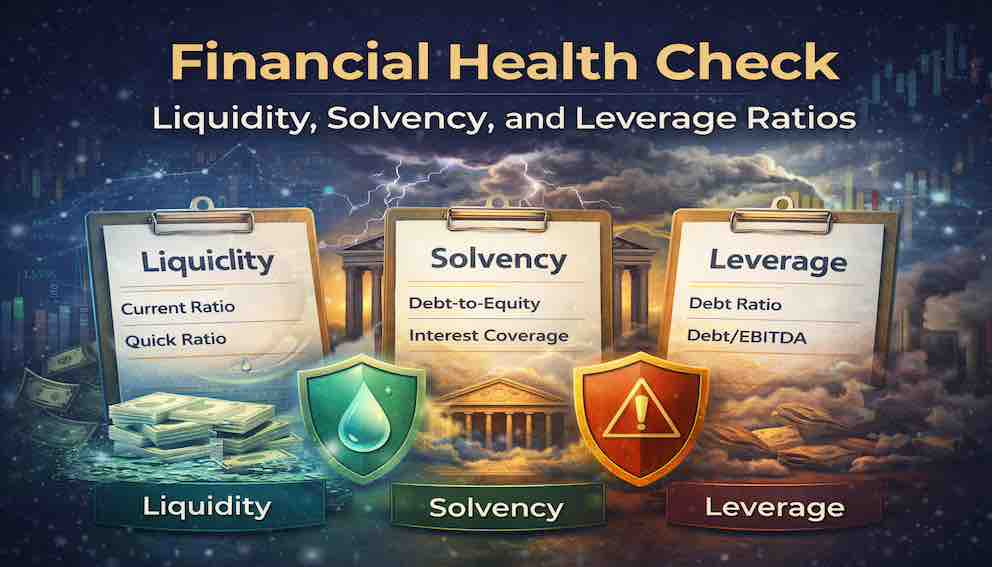
Financial Health Check: Understanding Liquidity, Solvency, and Leverage - Fundamental Analysis Series
A profitable company can still fail if it cannot survive financial stress. This tutorial explains how to assess a company’s financial health using the critical lenses of liquidity, solvency, and leverage. You’ll learn to read balance sheets with a focus on resilience, not just growth, and understand if a business can pay its bills today and endure downturns for years to come. Through clear explanations and concrete stories, we focus on what real financial strength looks like. By the end, you’ll be able to distinguish between a company that’s merely successful in good times and one that’s truly built to last.
Why Financial Health Matters More Than hype in Investing
Most investing stories start with exciting numbers. Soaring revenue and climbing profits suggest momentum and success. But these are fair-weather metrics. History teaches a different lesson: businesses rarely fail because their products become bad. They fail because they cannot survive a period of stress.
Think of a company like a bridge. Economic downturns, interest rate spikes, and supply shocks are the storms that test its integrity. The real question isn't how impressive the bridge looks on a calm day, but whether its foundations can withstand the pressure when the weather turns.
Financial health analysis is your engineering report for that bridge. Liquidity, solvency, and leverage aren't about predicting tomorrow's growth. They are survival metrics. They answer whether a business can pay its bills, manage its debts, and remain standing when conditions turn against it. For a long-term investor, this is non-negotiable. The most brilliant business idea is worthless if the company doesn't live long enough to see it through.
The Three Lenses of Financial Health
Financial health analysis requires a defensive mindset. It shifts the question from “How high can it fly?” to “How hard can it fall?” We use three distinct but connected lenses to examine a company's ability to withstand pressure.
- Liquidity: The short-term lens. Can it pay bills due this year?
- Solvency: The long-term lens. Is its overall financial structure sustainable?
- Leverage: The amplifier. How does debt magnify both success and failure?
Together, they move you from looking at a balance sheet as a static snapshot to reading it as a dynamic stress map of the business.
Lens 1: Liquidity – The Test of the Next 12 Months
Liquidity is about immediate survival. It asks: Does the company have enough easily accessible resources to meet obligations coming due within the year? This includes paying suppliers, employees, rent, and interest payments.
The Household Analogy: Imagine a family with a great annual salary but no savings. A sudden car repair creates a crisis, even though they are "profitable" on a yearly basis. Companies face the same cash crunch danger.
Liquidity analysis compares Current Assets (cash, inventory, receivables) to Current Liabilities (all bills due within a year).
The Current Ratio: Your First Financial Vital Sign
Current Assets ÷ Current Liabilities
This is your broad-stroke check. A result greater than 1.0 means the company has more short-term resources than short-term bills. It suggests a basic buffer.
- A Green Flag: A ratio between 1.5 and 2.0 typically indicates comfortable short-term health for many industries.
- A Yellow Flag: A ratio below 1.2 starts to show a tight cash position. You need to ask where extra cash will come from if needed.
- A Red Flag: A ratio below 1.0 is a warning siren. Current bills exceed available resources.
- A Note of Caution: A very high ratio (like 4.0 or 5.0) isn't automatically good. It can signal inefficiency—perhaps too much cash sitting idle or excessive inventory building up.
The Quick Ratio (The "Acid-Test"): A Stricter Examination
(Cash + Marketable Securities + Accounts Receivable) ÷ Current Liabilities
The Quick Ratio removes Inventory from the equation. Why? Because in a crisis, inventory can be hard to sell quickly or may have to be sold at a loss.
This ratio asks a tougher question: Could this company pay its imminent bills without selling a single item from its warehouse?
Context is King: A fast-fashion retailer needs a higher Quick Ratio than a grocery store. The grocer turns over inventory in days; the retailer might be stuck with last season's clothes for months.
Lens 2: Solvency – The Foundation for the Next Decade
If liquidity is about the next year, solvency is about the next decade. It examines the company's entire capital structure: Is it built on a stable foundation of owner's equity, or is it a precarious tower of debt?
Solvency problems are slow-motion crises. They often remain hidden until a downturn hits, credit tightens, and the company can no longer refinance its debts.
The Debt-to-Equity Ratio: The Ownership Blueprint
Total Debt ÷ Shareholders’ Equity
This ratio reveals the balance between money from lenders (debt) and money from owners (equity).
- A higher ratio means the company is more reliant on borrowed money.
- A lower ratio indicates a more conservative, owner-financed approach.
The Critical Insight: There is no magic number. A Debt-to-Equity ratio of 2.0 would be catastrophic for a tech startup but is perfectly normal for a capital-intensive utility company. You must compare a company to its own past and to its industry peers.
The Debt-to-Assets Ratio: What’s Truly Owned?
Total Debt ÷ Total Assets
This ratio shows what percentage of the company's total assets are actually owned by creditors. A ratio of 0.6 means 60% of every machine, building, and patent is financed by debt. Only 40% is truly owned by the shareholders. It’s a stark way to see how much of the business is on loan.
The Hidden Risk: Debt Maturity Walls
A company can appear solvent but still face a crisis if its debt is poorly timed. Imagine a business with manageable debt overall, but with 70% of it coming due for repayment within the next 18 months. If a recession hits and credit markets freeze, the company may be unable to refinance, forcing a fire sale of assets or bankruptcy. When analyzing solvency, always check the debt maturity schedule in the financial statement footnotes. A healthy company staggers its debt repayments over many years, avoiding dangerous "maturity walls."
Lens 3: Leverage – The Double-Edged Sword
Leverage is the use of debt to amplify returns. It's the financial equivalent of a lever: it makes lifting easier in good times, but if the ground gives way, the force works against you with devastating effect.
The danger of leverage is its silence during prosperity. When earnings are growing and interest rates are low, debt seems harmless. Its true nature is revealed only when conditions change.
The Interest Coverage Ratio: The Earnings Safety Net
Operating Income (EBIT) ÷ Interest Expense
This is the crucial connector between the Income Statement (profits) and the Balance Sheet (debt). It measures how many times a company's operating profits can cover its annual interest bill.
- A Green Flag (> 3.0): Strong coverage. Earnings can easily handle interest costs, even with a modest dip.
- A Yellow Flag (Approaching 2.0): Declining coverage is a warning sign. The margin of safety is thinning.
- A Red Flag (< 1.5): Extreme danger. A small decline in profits could mean the company cannot pay its interest from operations, forcing it to borrow more just to pay old debts—a potentially fatal spiral.
The Ultimate Reality Check: Cash Flow Coverage
The Interest Coverage Ratio uses accounting earnings (EBIT). An even more conservative test is to use cold, hard cash. The Cash Flow Coverage concept asks: "Can the company's operating cash flow cover its interest payments?"
This is a powerful check because operating cash flow is much harder to manipulate with accounting than earnings (EBIT). A company might show strong EBIT coverage but weak cash flow coverage if it's growing rapidly and tying up cash in inventory and receivables, or capitalizing expenses. A large, persistent gap between these two measures is an early warning sign that the "quality" of earnings may be poor. In a crisis, banks care about cash, not accounting profits.
The Analyst’s Guide: From Numbers to Narrative
Don't just calculate ratios; interpret the story they tell together. Here’s how to translate the signals:
The Story of a Resilient Company:
- Liquidity: A Current Ratio comfortably above 1.5, supported by a healthy Quick Ratio.
- Solvency: A Debt-to-Equity ratio in line with or below its stable industry peers, with no looming debt maturity wall.
- Leverage: An Interest Coverage ratio steadily above 3.0, backed by strong operating cash flow.
The trend across several years is stable or improving. This company isn't just surviving; it has the architectural strength to endure storms.
The Story of a Company on Shaky Ground:
- The "Illiquid but Solvent" Firm: Current Ratio below 1.0, but okay long-term solvency ratios. The story: "We own valuable assets but can't pay this month's rent."
- The "Over-Leveraged" Firm: Fine Current Ratio, but a soaring Debt-to-Equity ratio and a falling Interest Coverage ratio. The story: "We have cash today, but we've mortgaged our future and are one bad quarter from a crisis."
- The "Earnings vs. Cash Mismatch" Firm: Solid Interest Coverage but weak cash flow coverage. The story: "Our profits look good on paper, but the cash isn't making it to the bank account."
The Golden Rules of Analysis:
- The Cyclicality Rule: Financial health must be judged through the lens of business volatility. A "safe" debt level for a stable utility is reckless for a cyclical automaker. The more unpredictable the earnings, the more conservative the balance sheet must be.
- Trends Over Snapshots: Is the Debt-to-Equity ratio creeping up each year? That’s more telling than its value today.
- Peer Comparison is Everything: A "high" ratio is only meaningful if it's high for that specific type of business.
- Read the Footnotes: Look for off-balance-sheet obligations like operating leases or pension liabilities that act like hidden debt.
A Tale of Two Factories: A Story in Ratios
Let’s bring this to life with two fictional manufacturing companies, each with $10 million in annual profit.
Anchor Manufacturing (Stable Industry)
- Current Ratio: 2.2 | Debt-to-Equity: 0.5 | Interest Coverage: 10x | Cash Flow Strong? Yes
- Debt Maturity: Staggered over 10 years.
- The Story: Anchor has ample cash, funds itself with equity, and its profits cover interest ten times over. Its debt is long-term. In a recession, Anchor can focus on protecting its market share and even making strategic investments. It negotiates from a position of strength.
Precipice Industrial (Cyclical Industry)
- Current Ratio: 0.9 | Debt-to-Equity: 2.8 | Interest Coverage: 1.9x | Cash Flow Strong? Weak
- Debt Maturity: 40% due in 18 months.
- The Story: Precipice is cash-tight, reliant on debt, and profits barely cover interest. Its cash flow is weaker than its profits suggest, and a huge debt payment is due soon. A 15% drop in profits would trigger a crisis. In a downturn, Precipice isn't fighting for growth; it's fighting for survival at the mercy of nervous lenders.
The difference is financial architecture and timing. One is built to endure storms; the other is vulnerable to the first strong wind and has a debt wall looming on the horizon.
Your First Health Check: A Practical Exercise
- Choose a "Simple" Company: Pick a business with straightforward operations, like Clorox (CLX) or Kellogg's (K). Avoid banks, insurance, or complex tech for now.
- Gather the Data: Go to the company's Investor Relations website and find the last annual report (10-K). Locate the Balance Sheet, Income Statement, and Cash Flow Statement.
- Perform the Checkup (15 Minutes):
- Liquidity: Calculate the Current Ratio. Is it above 1.5?
- Solvency: Find Total Debt and Total Equity. Calculate Debt-to-Equity. Glance at the footnotes for the "Long-Term Debt" note—does any debt mature soon?
- Leverage: Find Operating Income (EBIT) and Interest Expense. Calculate Interest Coverage. Then, find Operating Cash Flow—is it a healthy, positive number?
- Ask the Key Question: "If the economy slowed down next year and credit became tight, does this company's financial structure and cash flow give it the strength to adapt, or would it be pushed into a corner?"
Conclusion: The Bedrock of Intelligent Investing
Financial health analysis is the discipline of preparing for winter while others enjoy the summer. In this tutorial, we learned to use three lenses—Liquidity, Solvency, and Leverage—and introduced critical real-world checks for debt maturity and cash flow coverage.
We discovered that true strength is a coherent story of balance and timing: enough cash for today, a sensible and well-structured debt load for the long run, and ample, high-quality cash flow to service that debt comfortably. This creates a margin of safety, the most valuable asset an investor can identify.
A business that survives downturns gains the ultimate advantage: time. Time for management's strategy to work, for investments to compound, and for competitive strengths to deepen. For the long-term investor, financial health isn't a secondary check-box; it is the essential foundation upon which all other analysis—of growth, management, and value—must be built.
In our next tutorial, we will explore what this healthy foundation can support: superior profitability. We'll move from survival to thrival, learning how to identify companies that don't just endure, but efficiently convert their resources into exceptional returns.
💡 Reflection: Think of a company you believe is "strong." Based on what you've learned, what specific financial characteristic (e.g., lots of cash, very little debt, long-dated maturities) forms the basis of that belief? How would you check it?
About Swati Sharma
Lead Editor at MyEyze, Economist & Finance Research WriterSwati Sharma is an economist with a Bachelor’s degree in Economics (Honours), CIPD Level 5 certification, and an MBA, and over 18 years of experience across management consulting, investment, and technology organizations. She specializes in research-driven financial education, focusing on economics, markets, and investor behavior, with a passion for making complex financial concepts clear, accurate, and accessible to a broad audience.
Disclaimer
This article is for educational purposes only and should not be interpreted as financial advice. Readers should consult a qualified financial professional before making investment decisions. Assistance from AI-powered generative tools was taken to format and improve language flow. While we strive for accuracy, this content may contain errors or omissions and should be independently verified.